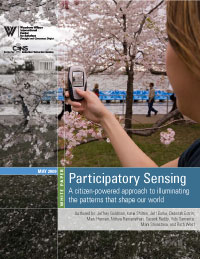
 Participatory Sensing is an approach to data collection and interpretation in which individuals, acting alone or in groups, use their personal mobile devices and web services to systematically explore interesting aspects of their worlds ranging from health to culture.
The number of authentic topics for Participatory Sensing projects is probably as large as the number of potential participants! We list here several illustrative examples, some of which are more environmentally focused and some more personal in nature. In all cases the computational thinking needed to frame the problem, design the experiment, develop the software, and analyze the results provides very rich learning opportunities in the context of a math, science, or computer science course. Neither this list nor the supporting categories are meant to be in any way exhaustive or complete.
Transportation
Students map their travel patterns during the course of days/weeks, analyze them for options reducing their carbon footprint, select a goal and, as a class, try to measurably reduce their transportation impact.
Data: Smart phone application captures activity-decorated location and time series.
Recycling
Students document the availability and actual usage of recycling bins around campus or in their neighborhoods, analyze what options exist to increase efficacy, and estimate possible savings if the change were implemented.
Data: Focused, systematic geocoded and tagged image capture.
Water
Students conduct systematic inventories of public sprinkler systems and water fountains and measure their conformance with water conservation regulations or best practices.
Data: Focused, systematic geocoded and tagged image capture.
Safety
Students document the safety and comfort of transportation options, including ratings of busstops, particular buslines at particular times of day, walking paths (safe paths to school), etc.
Data: Focused, systematic geocoded and tagged image capture.
Asthma/Allergy
Students, document the tree species and distribution throughout their neighborhoods, estimate where Asthma/Allergy triggers might occur in spring and calculate allergy-optimized running path maps for the neighborhood.
Data: Focused, systematic geocoded and tagged image capture.
Neighborhood Stress/Chill Maps
Students document their campuses and neighborhoods by creating Stress/Chill Maps in which they note particular context (a time and place and situation) that causes them stress or pleasure. Students analyze their data in small groups to explore similarities and differences.
Data: Focused, systematic geocoded and tagged image capture.
Daily Habits
Students select a personal behavior that they want to better manage, and use prompted queries on the phone to report on their behavior several times a day (whether in regards to sleeping, eating, angry outbursts, biting nails, or procrastinating). They then use statistical techniques to look for correlations between these behaviors and other factors in their lives. They might also attempt a behavior change and see if they are able to affect measurable change.
Data: A time and geo-coded series of self-reported observations.
Participatory Sensing Related Links
- Participatory Sensing White Paper: A citizen-powered approach to illuminating the patterns that shape our world
- Participatory Sensing on YouTube
- CENS Participatory Sensing Research Project Reports
- CENS Technical Publication on Participatory Sensing
- CENS Participatory Sensing Learning Opportunities for Students
